Investors are usually more focused on the fundamental basis while traders usually trade according to technical analysis. Technical analysts focus on charts of price movement and various analytical tools, they apply technical indicators to charts of various time frames in attempts to accurately forecast future price movements (support and resistance, moving averages, chart patterns, trendlines, MACD, oscillators, SMA, EMA..). While investors may be content with a 10 to 15% annual return, traders might seek a 10% return each month. Trading is an active style of participating in the financial markets in which traders seek short-term price moves in order to profit instead of waiting to profit from long-term price movements. According to technical analysis market price movements are not purely random but move in identifiable patterns and trends that repeat over time.
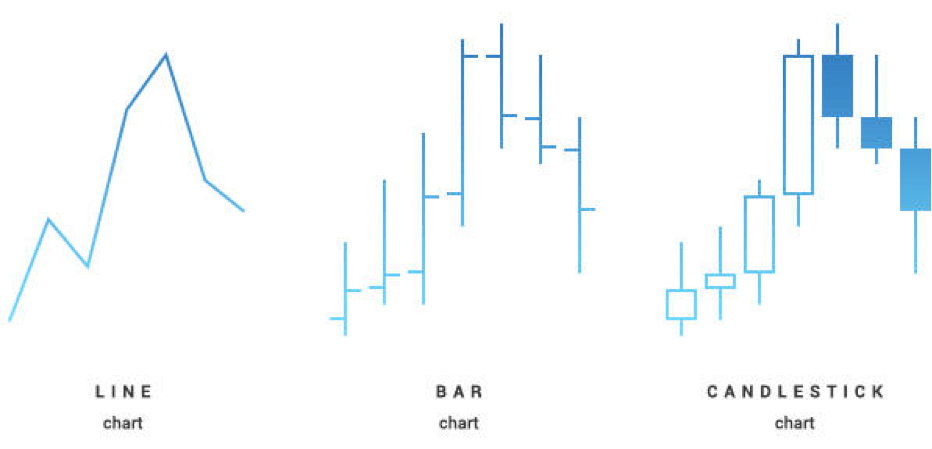
Technical analysis is used to attempt to forecast the price movement and technical analysts apply technical indicators to charts of various time frames (one-minute time frames, hourly, daily, weekly and monthly charts). The three most popular types of charts are candlestick chart, line chart and bar chart. Candlestick charts show the same price information as a bar chart, but in a prettier, graphic format while line chart draws a line from one closing price to the next closing price. Bar charts are also called “OHLC” charts, because they indicate the Open, the High, the Low, and the Close price.
The most common tools include support and resistance, trend lines, moving averages, Fibonacci, MACD indicator, chart patterns:
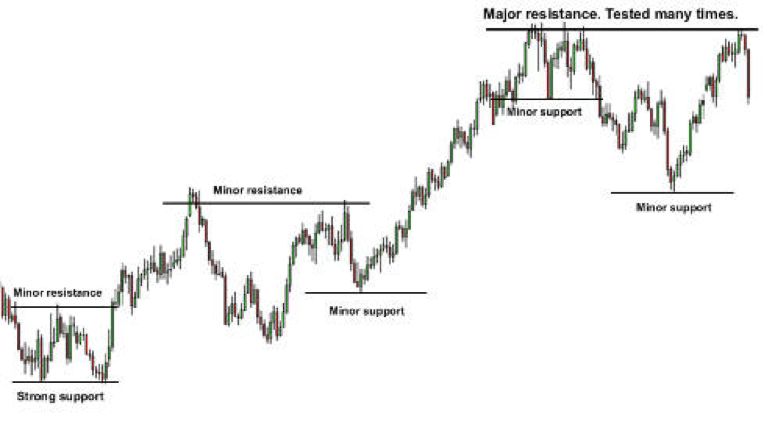
- Support and resistance are the most widely used concepts. The more often price tests a level of resistance or support without breaking it, the stronger the area of resistance or support is. When the price passes through the resistance, that resistance could potentially become support.
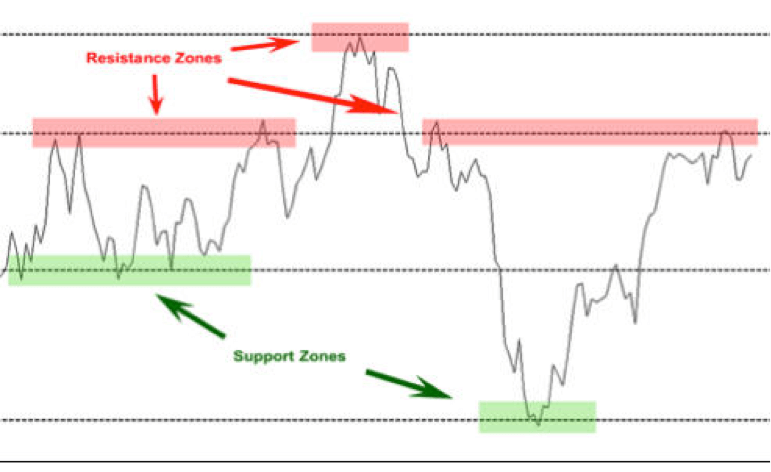
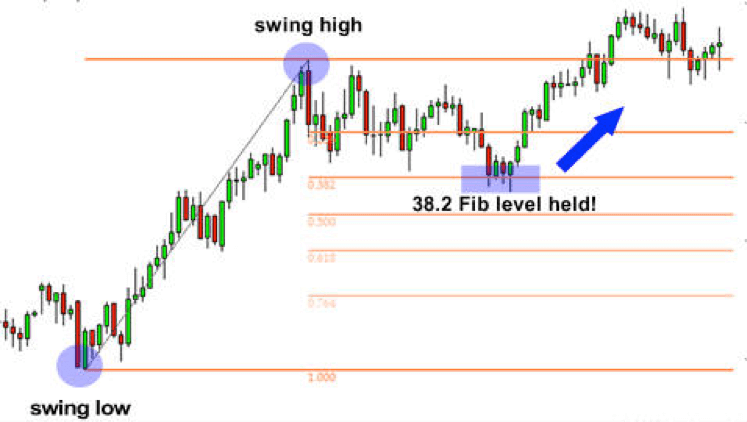
- The picture below shows how traders can use supports level for making trading decisions. In the uptrend when they get a “bullish” confirmation candle on the support they can open the position with stop-loss order below this support. Often times you will see a support or resistance level that appears broken, but soon after find out that the market was just testing it.
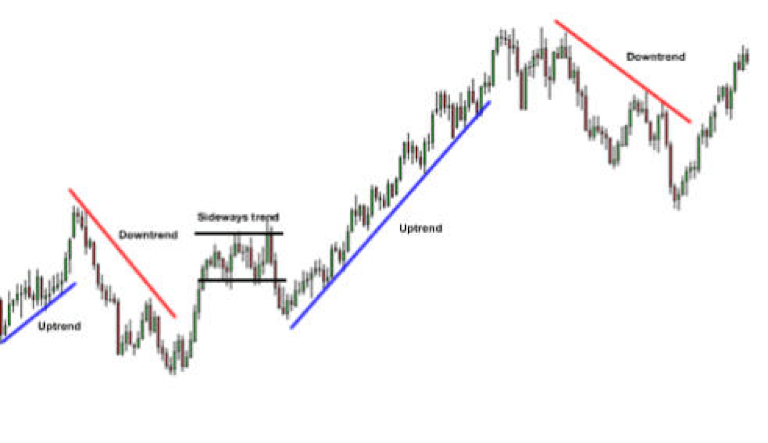
- Trend lines are one of the most important tools in technical analysis. There are three types of trends – uptrend, downtrend and sideways trends. Most traders don’t draw them correctly, all you have to do is locate two major tops or bottoms and connect them. Ascending and descending channels are also the very good tool in technical analysis which can be used to determine good places to buy or sell (in combination with trend line).
- Fibonacci retracement and extension levels – traders use this retracement levels as potential support and resistance areas, extension levels are profit taking levels.
- Moving Averages – this indicator is used to help us forecast future prices, the two major types are simple and exponential. One way to use moving averages is to determine trends, if MA lines cross over one another, it may signal that the trend is about to change soon. The moving averages can also be used as non-traditional support and resistance levels. Simple moving averages are slower to respond to price action, the exponential moving average can help you spot a trend faster.
- Popular chart indicators in the technical analysis are also: Bollinger Bands, MACD indicator, parabolic SAR, Stochastic Indicator, Relative Strength Index (RSI), Average Directional Index (ADX)
- Chart patterns – flags, rectangles, head and shoulders pattern, cup with the handle.. Chart patterns look at the big picture and help to identify trading signals – or signs of future price movements.
The example of technical analysis
Ethereum = $ 302.17, 09.09.2017
When we take look at this 6 months chart we can see that major trend is “bullish” (uptrend). As long the price is above this trend line there is no indication of the long trend reversal and ETH is in the BUY zone (Big Investors are still in the long – BUY position on this crypto).
Support levels are 200 and 300 USD, resistance levels are 350 and 400 USD. Rising above 400 USD level (psychological resistance) is important to achieve the waited targets, this supports the continuation of bullish trend overview efficiently for the upcoming period. According to Elliott wave theory, this could be the beginning of the wave 3 (This is usually the longest and strongest wave).
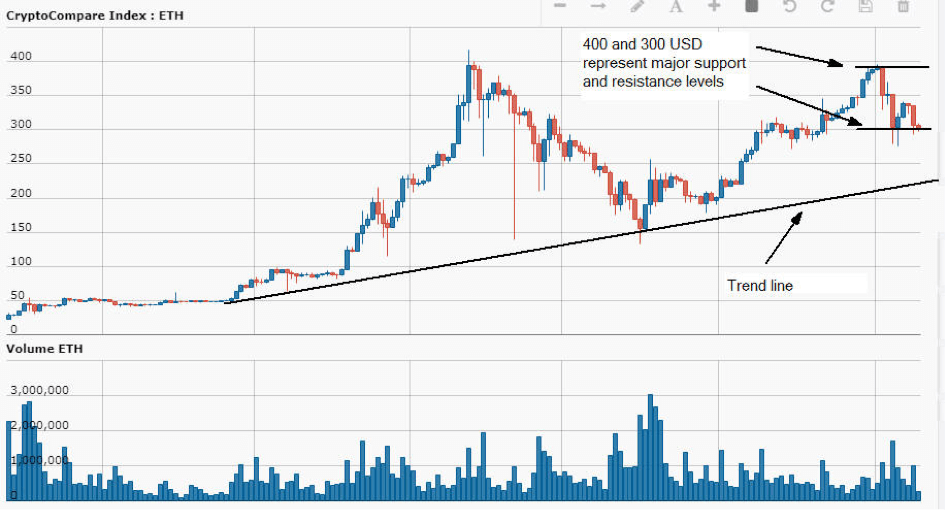
Recommendation: if the price jumps above 350 USD that would be a strong “BUY” signal and 392 USD could be a first price target (short term traders can put stop loss at 340 USD). If the price drops below 300 USD support that would be a strong “SELL” signal and the open way to 200 USD. Rising above 400 USD level (psychological resistance) is important to achieve the waited targets, this supports the continuation of bullish trend overview efficiently for the upcoming period.
Summary
Technical analysts study price movement, they look at historical price movements and determine the current trading conditions and potential price movement. Technical analysts try to spot trends, support and resistance levels, chart patterns which could help them find some great trading opportunities. While investors may be content with a 10 to 15% annual return, technical analysts might seek a 10% return each month. Lots of traders have been wondering whether the technical analysis used in Forex is the same when trading stocks or cryptocurrencies. The principles remain the same; however, you need to understand how each market behaves. The Forex market is so liquid, stock or cryptocurrency markets can have low volumes and activity. As a result, it may be hard to open and close positions when you’d like to. On forex the leverage typically allowed is significantly higher than for stocks. Becoming a profitable trader requires a strategic plan with short and long-term goals and the profitable traders use a combination of technical and fundamental analysis to make trading decisions.
What is Bitcoin?
It is a virtual currency in which transactions are confirmed using a computer’s transactions. Instead of the main bank supporting it, a computer called a “miner” goes out and solves each transaction (the process of adding a little information to a public record called a “hash” to create a hash) — but not through a bank or a central clearing house. Instead, the miner sends a set of new units to the network, along with a recording of what had happened to the total supply of these units at the time. The units are rewarded to the miner, but at a set rate of 1 to the khash (hash) unit, so the actual quantity of units released by miners has a link to the total supply of units. At first, miners agreed to share the rewards they obtained from the blockchain, but the miners were distributed coins as a reward, and the value of the units on the exchange market dropped accordingly. In 2014, the miners released their share of the rewards by releasing new units, through an algorithm called a halving.
Bitcoin is turned into fiat currency when your node receives a payment and sends it to your wallet. With Bitcoin, you take the risk of receiving or holding bitcoins that you do not own, and in theory, you lose money by losing bitcoins as they move from your wallet to a competitor.
What is Bitcoin mining?
Mining is the process of accepting a payment and adding new blocks to the blockchain. This is critical in Bitcoin mining because if you refuse to do so, the network grows so slowly that it eventually runs out of room for more work, requiring you to spend more time in the process. Once a certain block has been mined, that block is added to the blockchain.
How to trade with Bitcoin
There are several ways to trade Bitcoin, but for the sake of simplicity, I’ll walk through each of them here.
Bitcoin does not have a trading market. This is highly unlikely, as BTC is extremely volatile and there are probably a number of other ways to exchange BTC, including through localBitcoins.com, via tips or trades, or through retail or commercial exchanges.
There is currently a limited selection of exchanges that accept Bitcoin. You can buy and sell Bitcoin with credit cards or wire transfers, but it is better to buy directly with cash from a bank or broker – you do not need to make a deposit, wait for the money to clear, or hold bitcoin to hold a position. You can open a bitcoin account at a regulated exchange like Cboe or CEX.io, but in practice most people end up using money transfer services.
Note that unlike banks, exchanges do not directly provide a services bureau. There are often limitations or fees associated with credit cards and some banks will take a 10% or 20% cut of your transaction – usually far less than they charge you with a cash or debit card transaction, but still worthwhile. Although not recommended for first time customers, you can typically save up to 70% on fees with Google and Amazon selling certified gold or silver.
Rather than buying directly from your bank or broker, you can also buy bitcoin on exchanges that accept bitcoins (such as BitQuick or Gemini). But exchange trading is not suitable for beginners as you can lose money (though it’s not likely to affect your daily trading decisions as you’re likely to trade both altcoins and fiat currency). See our advice on trading for more information.
Risks to consider
It can be hard to understand the psychology behind speculating with Bitcoin. With so many people investing in Bitcoin that the reward has only increased in recent months, it’s easy to get sucked in without getting fully informed. Before investing any bitcoin, it’s worth reading up on how volatility works. Read our article about trading bitcoin for more information.
With Bitcoin, you can sell just as easily as buy. This is how trading Bitcoin works and is fairly straightforward. You can buy bitcoins and sell them at the same time, which is different to how it works with any other asset. In this way you have made a deposit into the market and have to wait for the price to fall before you sell.
With any asset, you need to remember to purchase or sell only when you are ready. Once you’ve bought bitcoins, you can sell them back into the market (or use them to make a profit) without waiting for the price to fall. Your current position will change as more bitcoins are added to the market, but no further. There is a lower limit to how many bitcoins you can hold before you enter a panic sell: ten.